
How the Student Engagement Score Is Calculated

When a class ends, Sonacove gives every student an engagement score out of 100 and a level from 0 to 5. You see the level next to each name, and the fair question is what went into it, especially for the quiet student who was listening the whole time.
Open the class from History and the Details tab lists everyone who came, with their level in the last column. Hover a level and the student engagement score behind it appears, broken into its seven parts.
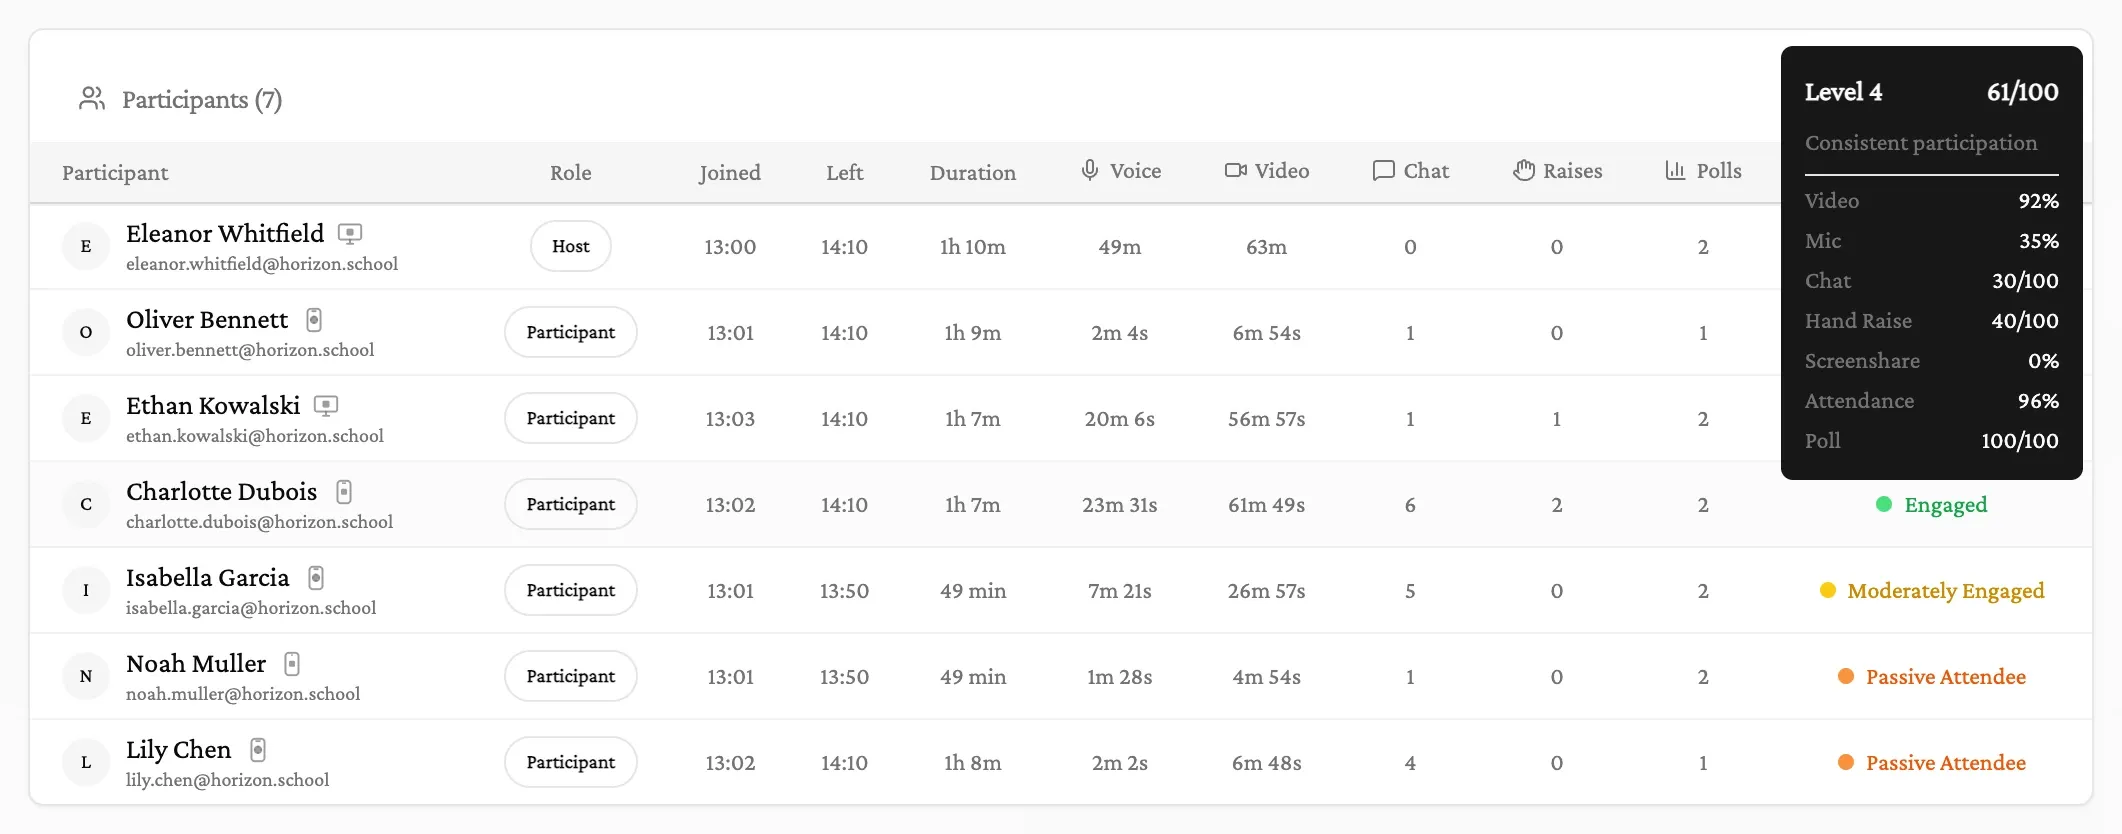
How is the student engagement score calculated?
The score is a weighted sum of seven items. Video and Mic are worth 20 points each, Chat, Attendance and Poll 15 each, Screenshare 10 and Hand Raise 5. Each item gets a value from 0 to 100, the value is multiplied by its weight, and the results are added up and rounded to a whole number.
Our server works the score out once, when the class ends, and stores it. The dashboard shows that stored result, so opening the class again next month shows the same number.
The biggest difference between the items is what each value is divided by. The weights below are as of October 2026.
Share of the student's own time in class
- Video20 pts
Camera-on time ÷ time present
Full marks: camera on the whole time they are there
- Mic20 pts
Unmuted time ÷ time present
Full marks: never muted. Talking is not required
- Screenshare10 pts
Sharing time ÷ time present
Full marks: sharing a screen the whole time
Share of the whole class
- Attendance15 pts
Time present ÷ class length
Full marks: there from the first arrival until the room closes
Counts turned into points
- Chat15 pts
5 points per message, up to 100
Full marks: 20 messages
- Hand Raise5 pts
20 points per raise, up to 100
Full marks: 5 raised hands
Polls
- Poll15 pts
Polls voted in ÷ polls run
Full marks: voted in every poll, or no polls were run
Score: Each value × its weight, added up and rounded to a whole number
| Item | Weight | How it is measured | Full marks when |
|---|---|---|---|
| Share of the student's own time in class | |||
| Video | 20 | Camera-on time ÷ time present | Camera on the whole time they are there |
| Mic | 20 | Unmuted time ÷ time present | Never muted. Talking is not required |
| Screenshare | 10 | Sharing time ÷ time present | Sharing a screen the whole time |
| Share of the whole class | |||
| Attendance | 15 | Time present ÷ class length | There from the first arrival until the room closes |
| Counts turned into points | |||
| Chat | 15 | 5 points per message, up to 100 | 20 messages |
| Hand Raise | 5 | 20 points per raise, up to 100 | 5 raised hands |
| Polls | |||
| Poll | 15 | Polls voted in ÷ polls run | Voted in every poll, or no polls were run |
| Score | 100 | Each value × its weight, added up and rounded to a whole number | |
The tooltip prints the time-based items as percentages and the counted ones as points out of 100. So “Chat 30/100” means 30 points, which is six messages, not thirty.
Where does a score of 61 come from?
Charlotte, the student with the tooltip open above, earns 18.4 points from Video, 15 from Poll, 14.4 from Attendance, 7 from Mic, 4.5 from Chat and 2 from Hand Raise. That adds up to 61.3, which rounds to 61 and puts her in Level 4.
Behind those points: her camera was on for 92% of the time she was in class, and she was unmuted for 35% of it. She sent six chat messages, raised her hand twice, voted in both polls, never shared her screen, and was present for 67 of the class’s 70 minutes.
Each block below is as wide as the item’s weight, so the seven blocks add up to 100. The filled part of a block is that item’s value, which makes the filled area the score. Hover a block to see its sum.
Video carries the most weight, so it does the most work in her score. Her six messages and two raised hands add 6.5 between them, and voting in both polls is worth a full 15.
What counts as time in class?
Video, Mic and Screenshare are measured against the time the student was actually in the room. Attendance is measured against the whole class, from the first arrival until the room closes. So a student whose connection drops loses Attendance for the gap, but the gap doesn’t count against their Video or Mic.
Here is a student in a 60-minute class who dropped out for five minutes.
- Camera and mic count as off at the start of every connection until the app reports them on. This student didn’t turn the camera back on after rejoining, which is why Video stops at 40%.
- The class clock starts when the first person arrives, usually the teacher, and stops when the room closes.
What do the engagement levels mean?
The score is placed in one of six bands, from Level 0 below 5 points to Level 5 at 80 and above. The label next to each student’s name is the band’s name, so “Engaged” means a score from 60 to 79.
Charlotte’s 61 sits just inside Level 4.
- Level 580–100Highly Engaged · Actively participating throughout
- Level 460–79Engaged · Consistent participation
- Level 340–59Moderately Engaged · Present, limited interaction
- Level 220–39Passive Attendee · Mostly listening only
- Level 15–19Low Participation · Minimal interaction
- Level 00–4Observer Only · Joined but no interaction
How do you work out a score yourself?
Use the calculator below. It runs the same formula as our server, so any combination of camera time, mic time, messages, raised hands and polls gives the score that student would get.
Start from one of the example students, or move the sliders and watch the blocks fill.
Share of their time with the camera on
Share of their time unmuted
5 points a message
20 points a raise
Share of their time sharing a screen
Time present as a share of the class
A couple of things show up quickly. A student with the camera on who barely speaks scores a little higher than one with the camera off who is busy in chat, because Video carries more weight than Chat. And polls matter more than they look: voting in every poll is worth as much as being there for the whole class.
How do you get engagement scores you can trust?
Treat the score as a record of what Sonacove could see during the class: camera, mic, chat, raised hands, polls and time in the room. A few habits keep that record accurate.
- Open the room at class time. The Attendance clock starts with the first person in the room. Open it ten minutes before a 50-minute class and a student who is there for every minute of the lesson gets 50 ÷ 60, or 83%.
- Know what Mic measures. Mic counts the time a student is unmuted, not the time they spend talking. Muting the whole class for a stretch of lecture lowers everyone’s Mic for that stretch, so mute everyone when the noise is costing you more than the points are worth. There is more on that trade-off in how to manage a noisy online classroom.
- Don’t wait for Screenshare. Few students ever share a screen, so for most of them 90 is the ceiling. Level 5 starts at 80, so it never stops anyone reaching the top band.
- Read counts as counts. Chat and Hand Raise add up actions, not their quality. A one-word reply counts the same as a good question.
- Run polls. A poll gives every student, including the quiet ones, a way to take part that the score can see. How to use polls in online teaching covers which questions are worth asking.
What can’t the engagement score tell you?
It can’t see attention. A student with the camera off who is following every word can score as a Passive Attendee, and a student with the camera on and their mind elsewhere can reach Level 3. One low score is a reason to look closer, not a verdict.
Camera time is the weakest signal of the seven. Jeremy Bailenson argued in Technology, Mind, and Behavior in 2021 that video calls carry loads face-to-face conversation does not. Keeping the camera off can be a sensible way to cope with that rather than a sign of drifting off. The same student at Level 1 three classes in a row is a pattern worth a conversation.
That is how the rest of the dashboard uses the score too. Analytics averages it across classes and students so you can follow the trend over weeks. In an organization with class rosters, a student whose average falls below 40 is listed under “Students who may need a nudge”, next to students who have missed classes.
Is this the same as the live engagement panel?
No. The engagement panel you see during class tracks who is active right now, gives points for speaking turns, raised hands, chat messages, reactions and camera time, and has levels of its own. The engagement score is worked out once, after class, from the whole meeting, and it is the one kept in your History.
The panel is covered in how to keep students engaged in online classes.
Related reading
- How to keep students engaged in online classes, for the interactions that move these numbers during a lesson
- How to use polls in online teaching, for the item most teachers underuse
- Sonacove Meets features, for the rest of the classroom tools